RYA-tips #19 – Practical weather planning
Zeilen is een combinatie van wetenschap en kunst. En voor wie daar meer over wilt weten schrijft Albert De Nijs, instructeur bij de De Zeezeilers van Marken wekelijks een rubriek met tips&trics van de Royal Yachting Association.
Which tools do we have at our disposal to get a picture of the weather?
When passage planning we tend to work from overview (large area) down to detail (zoom in – zoom out). We do this for our route planning, but also when weather planning.
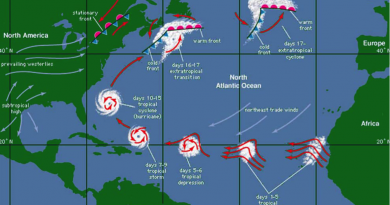
You can start with the weather charts of North Atlantic + Europe, then zoom in to your local area.
The tools you need depend largely on the length of the trip. For short day-sails a one day outlook is fine. For offshore passages more information is needed, for example the location and movement of frontal systems with associated weather. Once you go further offshore, start looking at complete weather systems and how those will affect our passage.
You can start analysing the weather charts forecast (Bracknell or NOAA Ocean Prediction Centre) some days before your trip and see how the weather develops. If the forecast for your planned trip remains steady, you can put more trust in it then when the outlook changes dramatically. This way you can get a ‘feel’ for the weather.
Large scale phenomena, such as low-pressure systems, fronts and troughs are forecasted really well. Smaller scale, or short-lived phenomena like squalls are more difficult to predict. If the weather chart indicates a cold front or trough line and the BBC shipping forecast warns for showers, better keep a good lookout. Squalls can pack lots of wind, gusts, rain, hail and limited visibility. It is the combination of knowing the bigger picture together with your local observation that’s really important.
Gribfiles are very useful in showing wind direction and speed, but are completely computer generated, and don’t show weather systems like depressions and frontal systems.
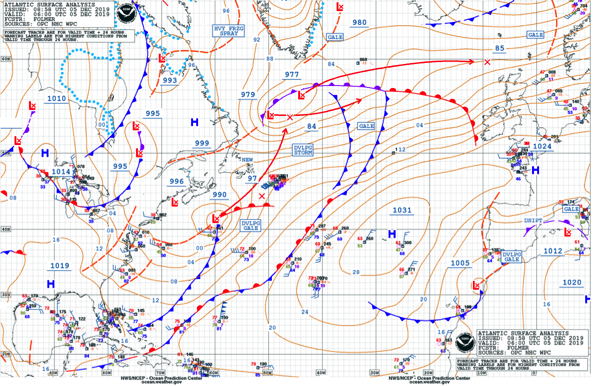
A meteorologist uses computer generated data, but ‘overlays’ his interpretation and draws in Lows, Highs, frontal systems, troughs etcetera. The NOAA charts also add wind speed, warnings and the location/movement of systems in the next 24 hrs. The combination of computer-generated data together with the knowledge and experience of a forecaster gives a more complete weather picture for several days ahead.
Underway you can update your weather plan with for example the BBC shipping forecast -which includes warnings- via VHF or Navtex. Some forecast areas are huge and timings like imminent, soon or later don’t give a lot of detail. It is then your own observation which completes the weather picture for your area.
Albert de Nijs, Dutch Offshore Sailing Academy