RYA-tips #21 – Nautical charts – source data is deficient by today’s standards
Zeilen is een combinatie van wetenschap en kunst. En voor wie daar meer over wilt weten schrijft Albert De Nijs, instructeur bij de De Zeezeilers van Marken wekelijks een rubriek met tips&trics van de Royal Yachting Association.
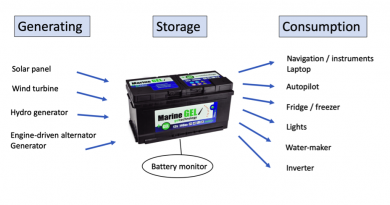
Our charts are a big jigsaw of separate surveys combined to form the final product. The accuracy of data on our charts (paper or electronic) is a combination of the accuracy of the underlying source data (surveys) and the chart compilation process. Most nautical charts are based on survey data collected by various sources over a long period of time, sometimes more than 100 years ago.
At that time hydrographic surveyors used triangulation for position fixes and lead-line measurements from rowing boats. Nowadays multibeam echosounder or Lidar is used.
On our (paper) charts we can find the survey data on which the chart is based. These source-diagrams indicate the year in which the survey for that area was carried out. You would need knowledge of past and present hydrographic surveying practices to assess the accuracy of the data, which is impractical in real life.
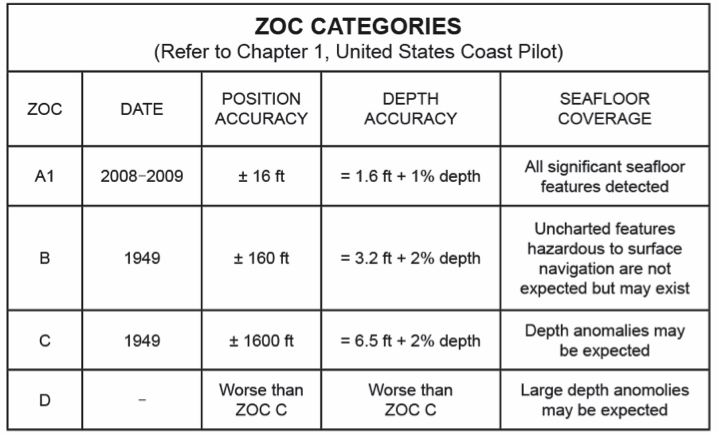
The new way of presenting this information is CATZOC – Category Zone of Confidence. In 4/5 zones it presents accuracy for the source data: position, depth and seafloor coverage.
Position accuracy is important. Before gps, charts were more accurate than the positioning methods used on board. As navigators, we still expect charts to be so accurate, but charts based on old survey techniques can never meet that expectation.
The accuracy of the soundings done 100+ years ago with a lead line and reduced to chartdatum is doubtful.
Seafloor coverage is possibly the most important aspect. This is the level of confidence that the hydrographic office has that the soundings that were collected as the survey ship steamed back and forth actually represent the remainder of the sea floor between the adjacent lines of sounding.
It ranges from ‘all significant seafloor features detected’ to ‘large depth anomalies may be expected’. Older surveys used ‘sample methods’ which produced spot measurements, with a high probability of missing important bottom features. With modern survey methods full-bottom coverage is achieved.
Chart compilation was a manual process until the early 1990’s, combining different horizontal datum systems and chart scales. Afterwards all these charts were scanned in raster format, together with their inherent inaccuracies.
The CATZOC presentation aims to give a direct picture of the underlying accuracies of the chart you are using. Commercially interesting routes, approaches and harbors are surveyed to the highest zone of confidence (ZOC A1). The waters where we sail are quite often unsurveyed. We need to realize that even though the chart is displayed on a chartplotter, it is no more accurate than the survey data it was based on!
Albert de Nijs, Dutch Offshore Sailing Academy