RYA-tips #22 – Digital navigation, old skills in new technology
Zeilen is een combinatie van wetenschap en kunst. En voor wie daar meer over wilt weten schrijft Albert De Nijs, instructeur bij de De Zeezeilers van Marken wekelijks een rubriek met tips&trics van de Royal Yachting Association.
As we’ve seen in the article about surveys, our (gps) position is quite often more accurate than the electronic charts upon which it is presented.
Keeping this in mind we can look at the best way to use the charts and navigation systems.
When teaching navigation, we focus on the traditional navigation tools such as compass, log, depth and paper charts. We are using dead-reckoning, bearings of landmarks, depth readings, and plotting (three point) fixes on paper charts. Navigating this way increases understanding of the underlying concept, but few sailors limit themselves to these traditional tools.
Integrated systems (plotter, charts, position, AIS, radar) have made navigation a lot easier, and we are quite happy to integrate these systems in our daily routine.
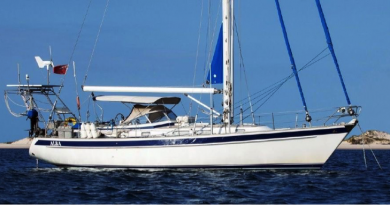
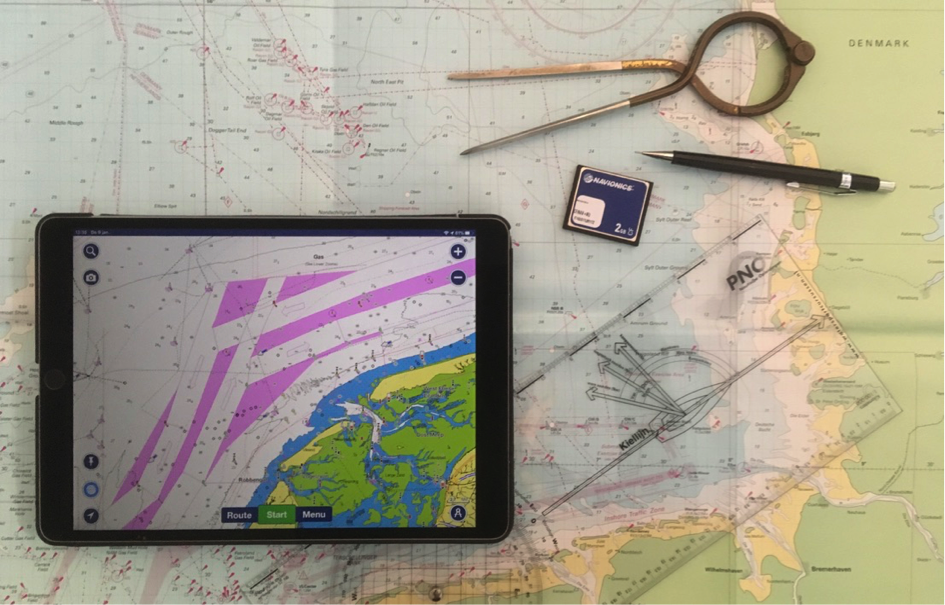
Personally, I prefer to use a mix of chart and navigation options. We use a small-scale paper chart for planning and overview, a Raymarine plotter at the wheel, a laptop running OpenCPN at the chart table and Navionics on an iPad. AIS is presented on both the plotter and the laptop. Paper and electronic, three gps devices, different charts, independent power supply, redundancy and backup is what I’m aiming to achieve.
There are two types of electronic navigation charts (ENC), raster and vector charts (see DOSA article publ. 28 May 2019).
A raster chart is basically a scan of a paper chart. Zooming in is like using a magnifying glass. Everything gets larger, but you don’t get more detail. The plus side is that you don’t lose detail when zooming out. Shallows, rocks or reefs (Team Vestas!) will appear at any zoom level.
Most electronic charts are vector charts. They consist of many layers. Depending upon zoom level you are presented with different information. Details can be ‘layered out’ and vital information can easily hide itself that way.
Using a vector chart, you’ll have to zoom out for overview and zoom in for the details. You normally don’t sail a fixed route; your track depends on wind and weather. You’ll have to check for navigational hazards along the intended track with a broad margin on both sides.
Passage planning has changed, but the same levels of intellectual curiosity, precision and skill are required.
Important things to consider when passage planning on electronic charts:
– Check correct scale of chart
– Know the possibilities and limitations of your navigation program (plotter, laptop, iPad)
– Check quality of survey (CATZOC or source diagram)
– Zoom out / zoom in for overview and detail
– Redo your passage-plan when changing your route
– Finally, doublecheck for navigational dangers using another source (paper or raster chart)
Albert de Nijs, Dutch Offshore Sailing Academy